Sixty Thousand Kernels
Days 3 & 4: Building in Public in OpenAI's Parameter Golf Challenge


Article 2 of an ongoing series. If you missed Article 1, I entered OpenAI’s Parameter Golf competition late, built the wrong architecture, got told to scrap it by my own AI system, pivoted, and briefly hit #1 on the merged leaderboard with PR #376 at 1.1401 bpb. That was Day 2.
Day 3 started with bad news.
I checked the leaderboard at 7am and PR #376 had already been lapped. While I was sleeping, the field moved. Not drifted. Moved. There’s a specific technical stack that the top competitors had converged on: 11 transformer layers, XSA attention, Partial RoPE, LN Scale, VE128, EMA, Late QAT, GPTQ-lite quantization. My submission wasn’t in the ballpark. It was on a different planet.
The bpb scores were lower across the board. The gap was real.
When you’re competing solo with no team and no institutional memory of a competition that’s been running for days before you arrived, you have an information problem. Further, I have no experience in this type of competition at all. I can’t read hundreds of pull requests. I can’t manually parse ablation tables, dig through commit histories, and cross-reference READMEs for fifty different experimental submissions in a single morning.
A human researcher cannot do that.
So I don’t.
I tasked my agentic research system with it. It ran through every top PR on the leaderboard: the merged ones, the open ones, the speculative frontier claims. It read the READMEs. It extracted the ablation tables. It built a picture of what was working and what wasn’t, and where the winning techniques were clustering.
This is, I think, the actual competitive variable in a competition like this. Not raw coding speed.
The top leaderboard entries aren’t meaningfully better coded than the middle entries. They’re better informed.
The researchers who built them knew which combinations of techniques would stack and which would cancel out. They knew which ablations were worth running and which were dead ends. That knowledge comes from reading the literature, from prior competition experience, from team discussion, and from whatever intelligence-gathering process you’ve set up. Mine happens to be agentic.
PR #549, from abaybektursun, was sitting at 1.1194 with a legal TTT approach. Frontier score, not merged yet, but legitimate. The merged SOTA from signalrush’s PR #414 was 1.1233. These aren’t random numbers. They represent specific technique choices that interact with each other in specific ways. You can’t just copy the score. You have to understand why the architecture produces it.
The verdict came back with the same energy as the previous day’s verdict, which is to say: uncomfortable.
“Your current submission is technically competent but strategically off-target. The best move is not ‘improve #376.’ It is ‘replace #376 as the optimization target with a #414-class base.’”
PR #414, submitted by signalrush, was the merged SOTA at 1.1233 bpb. It was also the clearest example of the full converged stack working in combination. My 1.1401 wasn’t a different approach that needed tuning. It was the wrong approach, period.
I closed PR #376. Started over. Second time in three days.
Before I got to the real work, I took a detour.
I spent Day 3 building custom Triton kernels. Specifically: FusedResidMixRMSNorm and FusedReLU2MLP. Autograd-compatible, hand-fused, the kind of thing you do when you think kernel efficiency is the bottleneck and you want to prove it by eliminating it.
I found two real bugs in the process. The first: calling .to(dtype) on a tensor detaches it from the autograd graph. Subtle, silent, wrong. The second: a persistent kernel grid was being capped below the actual tile count, which meant some tiles were never processed. Both required actual debugging to find.
Fixed both. Wrote the wrappers. Integrated them into the training loop.
Added 38ms per training step versus torch.compile.
Slower. The kernels were slower.
I shelved them. Another full day of work that went nowhere useful. I am getting efficient at discarding things I’ve built. There’s probably a lesson there about pre-optimization, but I’m not sure I had a better way to know without building it. The bugs were real. The fusion was correct. The compiler just already handles it better than I did.
Day 4. The real problem.
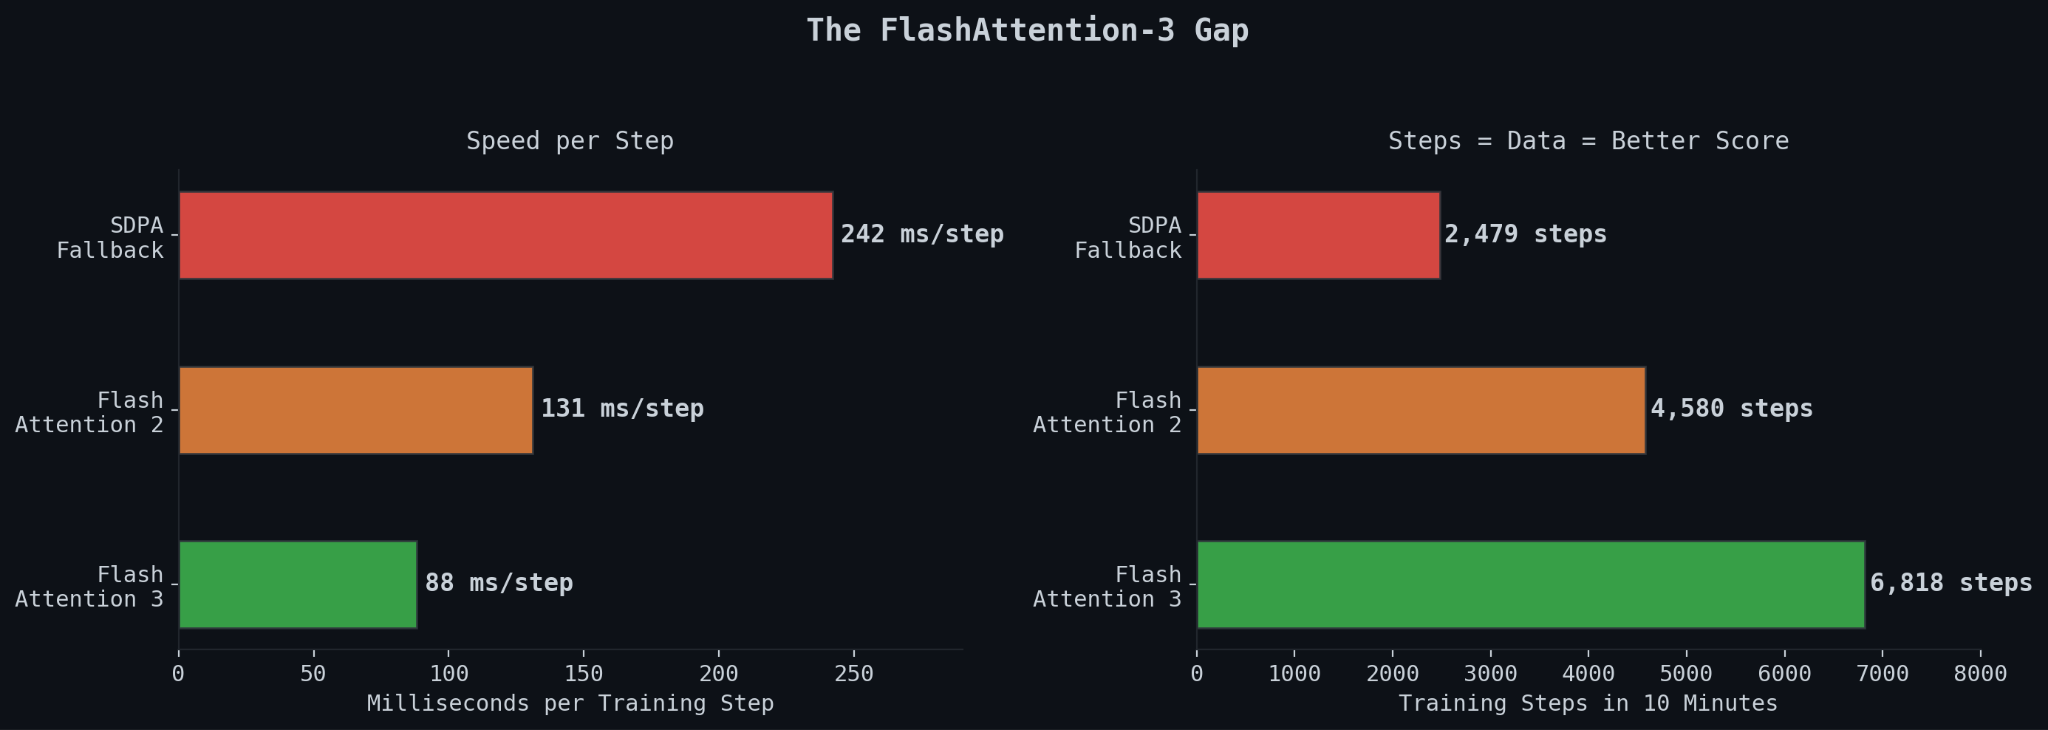
My training runs were clocking 99 to 131 milliseconds per step using FlashAttention-2 and SDPA. PR #414 was running at 84ms per step. That’s not a minor gap. The competition gives you 10 minutes of training time on 8xH100s. A 35% speed advantage compounds across every single step in those 10 minutes. More data seen, lower loss, better final score. The math is simple. The gap is structural.
The reason for the gap was one CUDA extension: FlashAttention-3, the Hopper-optimized version from Dao-AILab. FA3 uses a completely different kernel architecture designed specifically for H100 hardware. FA2 does not. If you’re training on H100s and not using FA3, you’re leaving a significant fraction of the hardware on the table.
FA3 is not a pip install. It requires compiling from source. And that’s where things went wrong for approximately 24 hours.
The build process compiles roughly 60,000 CUDA kernels. That is not a typo.
Attempt 1. I kicked off the build on a RunPod instance with a 20GB root disk. The compilation ran for over an hour before dying. Root disk filled to capacity, mid-build. CUDA kernel compilation generates enormous amounts of intermediate object files: .o files, cached compiler artifacts, temp staging directories. The disk just ran out. Killed. Clean up. Start over.
Attempt 2. Redirected the build output to /workspace, which has more room on RunPod. But pip defaults its temp directory to /tmp, which lives on the root disk regardless of where you point the output. The root disk filled again, different path, same error. Claude managed the retry loop on the environment setup. I made the call to try something different. Burned two hours.
Attempt 3. Provisioned a new pod with a 100GB root disk. Explicit temp directory overrides. Plenty of room this time. The pod was assigned to a datacenter in India. I watched the build run for hours, the line count climbing through the thousands, then tens of thousands. Then the network dropped. Not a clean failure. A partial one. Some kernels compiled, most didn’t, the state was corrupted, the cache was useless. Dead end.
Attempt 4. New pod, fresh region. Before the CUDA compilation even started, ninja failed to install. Ninja is the build tool that orchestrates the CUDA compilation. It’s not optional. It’s not a big install. It failed because of a network timeout on a package that’s a few hundred kilobytes. Not the 60,000 kernels. The tool that runs the 60,000 kernels. Failed before it even got started.
At some point around attempt three I started doing the math on what this was costing in GPU time. The answer was uncomfortable. GPU instances aren’t free while you’re watching them fail. Every provisioned pod, every build that ran for two hours before dying, every minute spent debugging environment configuration: all of it billed. I was spending real money on builds that produced nothing. Not experiments. Not data. Not model weights. A wheel file that didn’t exist yet.
Final attempt. Migrated to a new region entirely. Clean pod. Stable network. Set up the environment from scratch, redirected all temp directories explicitly, started the build.
The build log reached 61,300 lines.
The output wheel was 442 megabytes.
It compiled. Halle-f*cking-lujah.
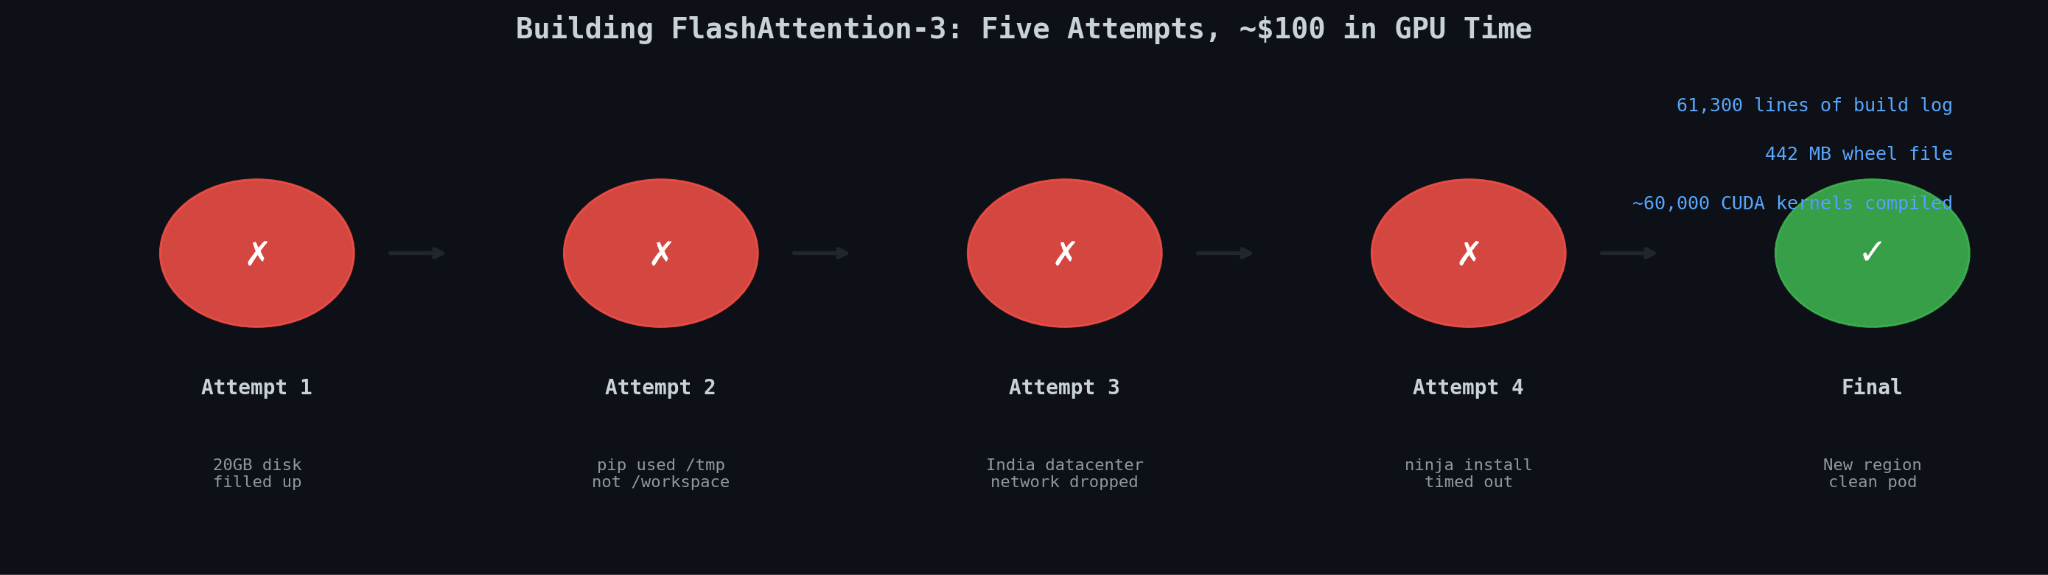
Total cost of getting a CUDA extension to build: somewhere over $100 in compute and most of my remaining sanity slash will to live. For a dependency. Not for training. Not for experiments. For the thing that lets you run the thing that lets you train the model. Yes there are pre-built wheels out there - for torch 2.8 as far as I could find - the official pod template runs 2.9.1 so we had to build as far as I know. Did my research agents fail me?
I’m not complaining. Everyone in this competition deals with similar infrastructure friction. This is just what it looks like when you’re doing this solo on a budget without a team to parallelize across. The top teams have people who’ve already solved this. I had Claude managing retry loops and me deciding when to abandon a pod. There’s tons of people who probably didn’t even notice this in this competition. They’re probably not reading this.
The first training run with FA3: 1.1229 bpb. 88ms per step.
That’s it. That’s the whole story of the speed gap. Matched verified SOTA on the first run after getting the dependency installed. I had been running at 99-131ms per step for two days thinking my architecture was the problem. It wasn’t. Swap one attention kernel for another and you drop to 88ms and the score follows.
The technique stack was right. The architecture was right. The only missing piece was the kernel.
1.1229 bpb. PR #414 sits at 1.1233. I was sitting at better-than-SOTA on a legitimate run.
And then I looked at the artifact size.
16.16 megabytes.
The competition limit is 16 megabytes. Not 16.16. Sixteen.